Sustainability Metrics
Data is referenced against Ateneo de Manila University School Year (June to May)
Water | Energy | Food | Waste | Other Metrics
Water
Volume of Water Used | Rain Harvesting (Water Reuse)

The Ateneo de Manila University's water consumption totaled 82,990 cubic meters for the period of June 2024 to August 2024. This figure depicts the inbound water supply, which includes both treated water and water supplied by the water utility company (Manila Water). The campus uses this water for a variety of purposes, including facility maintenance, academic building support, and daily student and staff requirements.
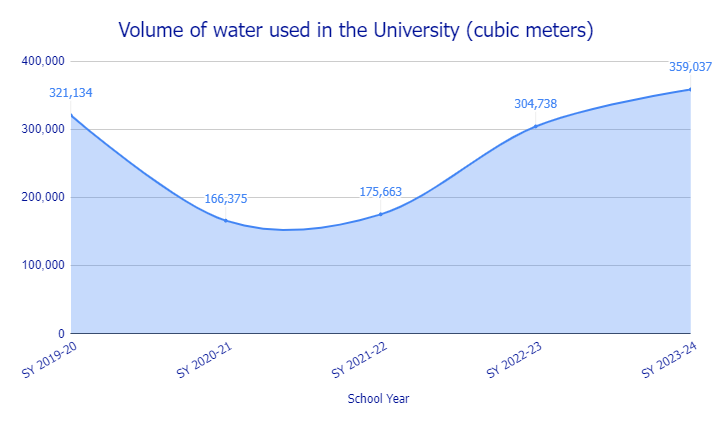
Volume of Water Used
Water consumption, in terms of volume of inbound water (treated/ extracted water) (in cubic meters) has dramatically varied over five years, with a record of 321,134 m³ in SY 2019-20, followed by a decline during the pandemic years of SY 2020-21 and SY 2021-22. With the post pandemic return to onsite operations soared at 304,738 m³ in SY 2022-23 and further climbing at 359,037 m³ in SY 2023-24, reflecting the post-pandemic return to full campus activity.
Return to Water | Return to Top
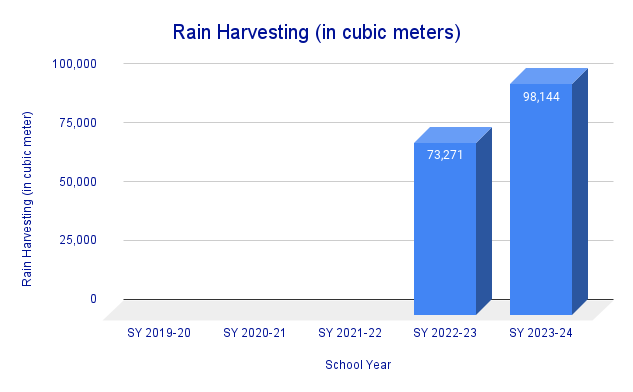
Rain Harvesting (m³)
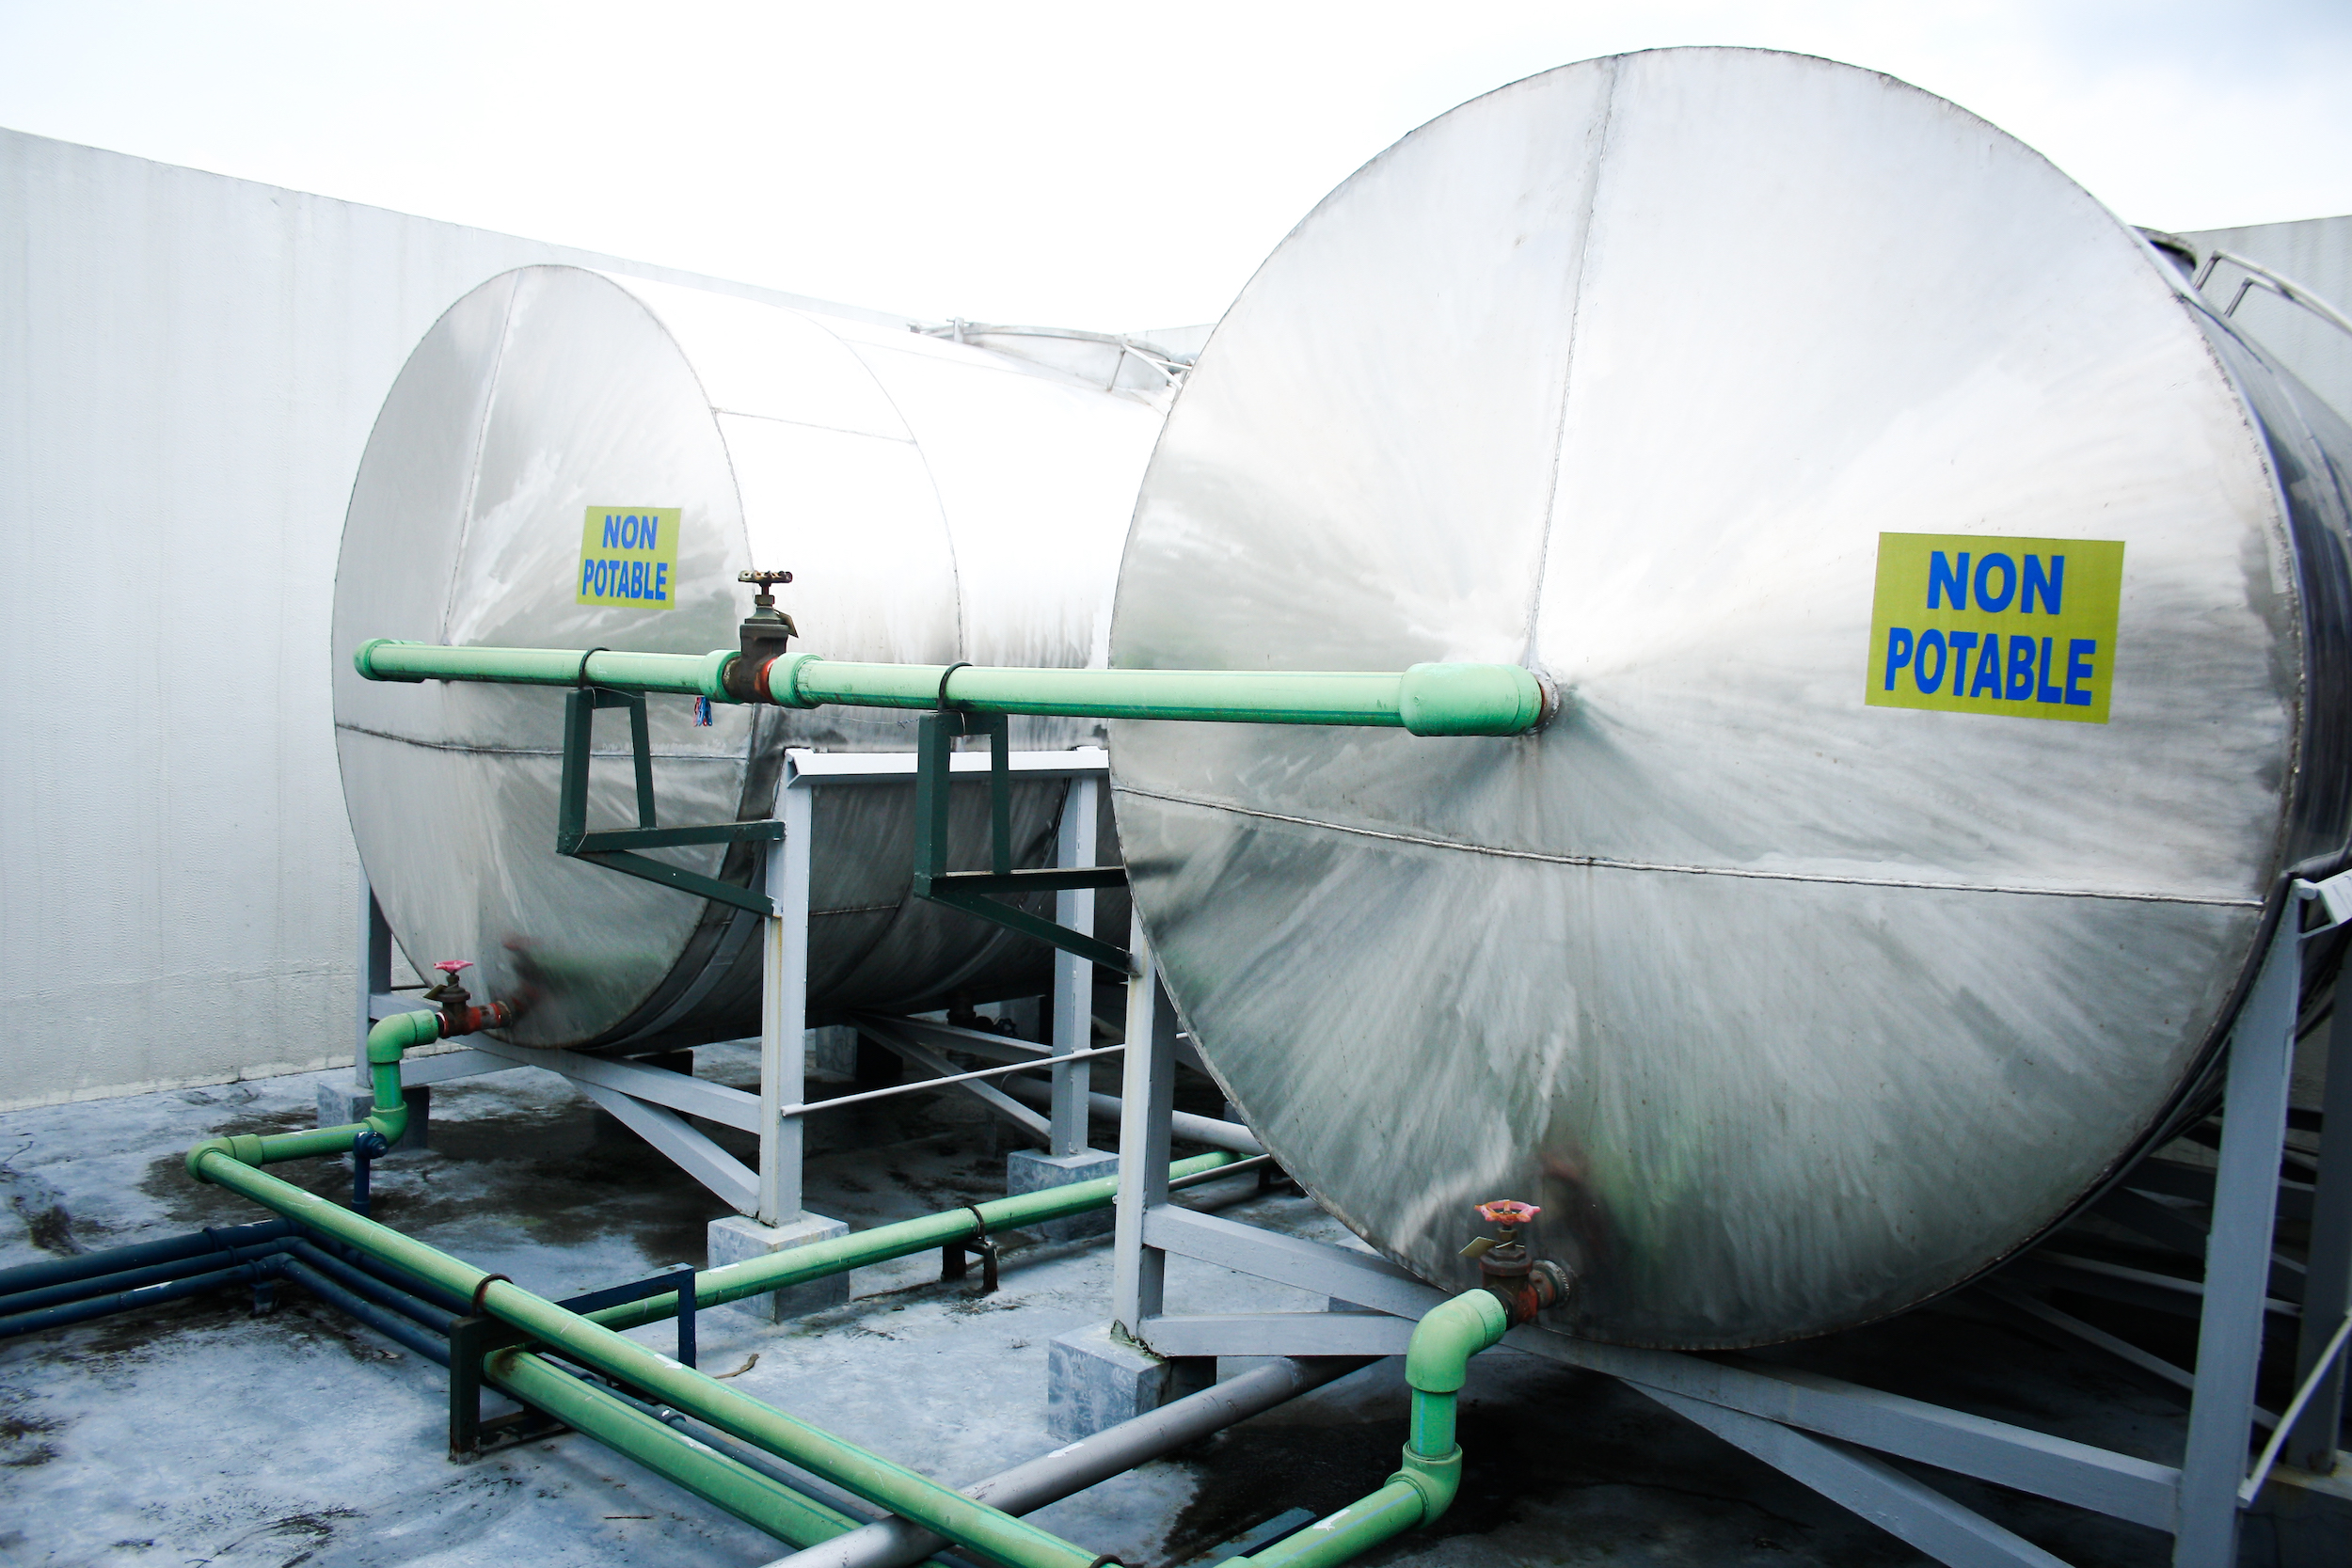
Rainwater harvesting continues to be operational at the New Rizal Library and the Cervini Cafeteria. The collected rainwater is filtered and used to flush the toilets, further reducing the consumption of municipal water.
From June 2024 to September 2024, the University has harvested and re-used 1,542 m³ of rain water.
Return to Water | Return to Top
Energy
Total Energy Used | Total Energy from Renewables
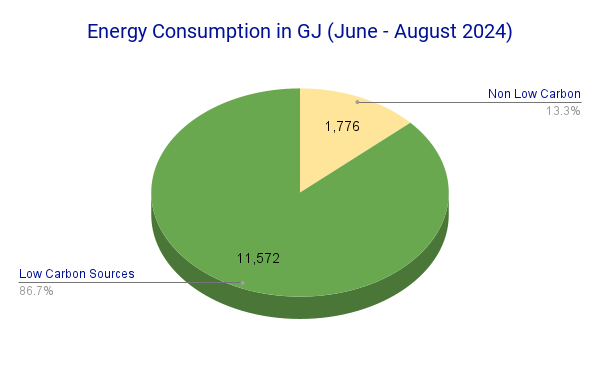
For June 2024 to August 2024, the University's total energy consumption amounted to 13,348 gigajoules (GJ) (3,707,744 kWh) where 11,572 GJ (3,214,444 kWh) of it are sourced from low carbon sources.

Total energy used (GJ)
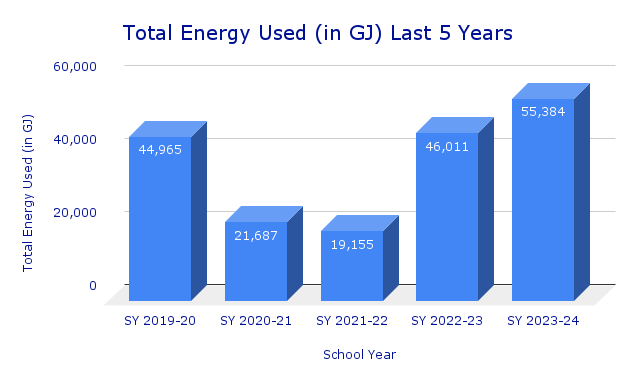
The University’s total energy use (in GJ and kWh) has varied widely across the five school years, with SY 2023-24 marking the highest energy consumption at 55,384 GJ (or 15,384,440 kWh). This also records a significant increase from SY 2022-23, which had 46,011 GJ (12,780,900 kWh).
Return to Energy | Return to Top
Total Energy from Renewables (kWh)
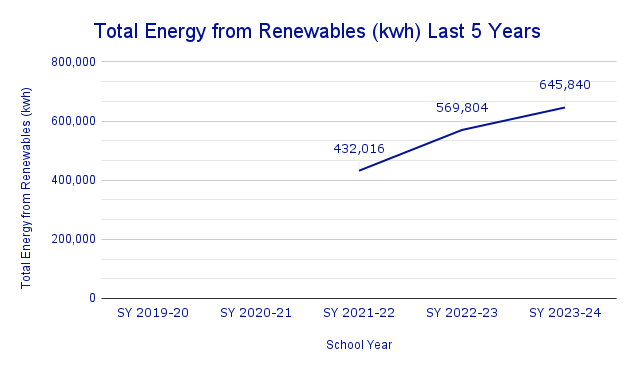
As of August 2024 of this School Year (2024-25), the total energy from renewables used by the University is 3,214,444.09 kWh.
School Year 2023-24 shows a remarkable jump in renewable energy contribution at 645,840 kWh, which is higher than the previous year's renewable energy (569,804 kWh), demonstrating investment in renewable energy sources.
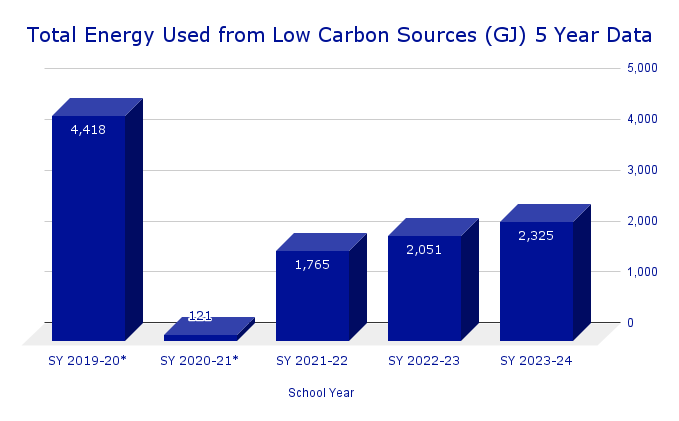
A noticeable leap took place between SY 2022-23 and SY 2023-24 with low-carbon energy usage increasing from 2,051 GJ to 2325.02 GJ, demonstrating the University’s shifting priorities towards decarbonizing its energy supply.
Return to Energy | Return to Top
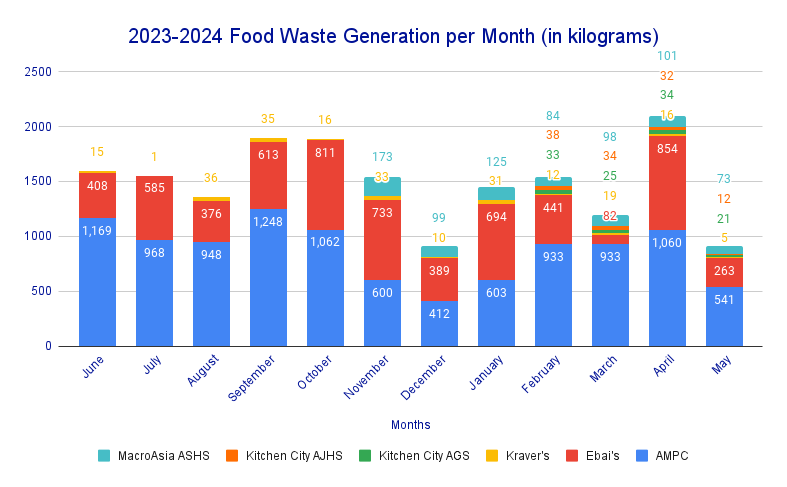
Food

During the 2023-2024 school year, the University generated 17.94 metric tons (17,937 kilograms) of food waste. This waste includes food scraps from the kitchen, trimmings, peelings, leftovers from the dining area, and used oil. Produced primarily through dining services and cafeterias, the University is actively addressing this issue by implementing waste reduction strategies, such as portion control and on-campus composting efforts. These initiatives aim to minimize the environmental impact of food waste while promoting sustainability and responsible consumption across the campus community.
Return to Top
Waste
Waste Generated | Waste Recycled | Waste Sent to Landfill
Scope 1 Emission | Scope 2 Emission
Scope 1 & 2 for the Baseline Year | Baseline Year Began Recording Emissions GHG Standards
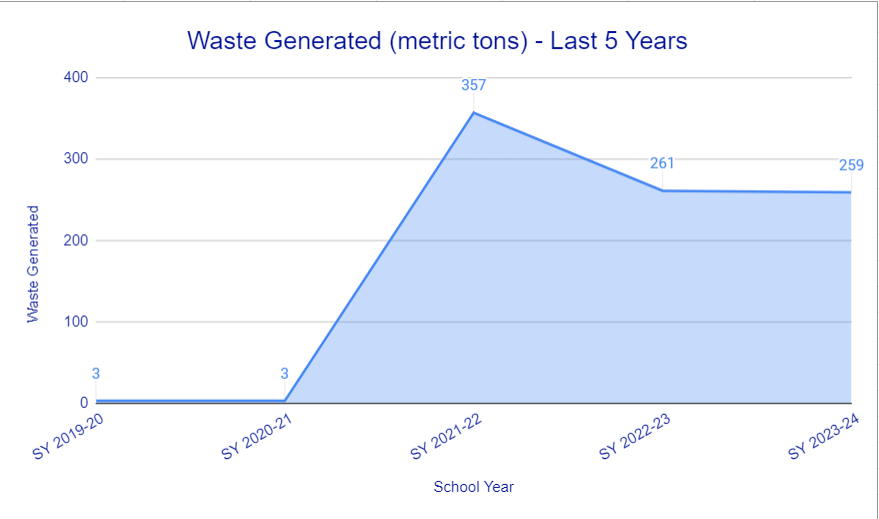
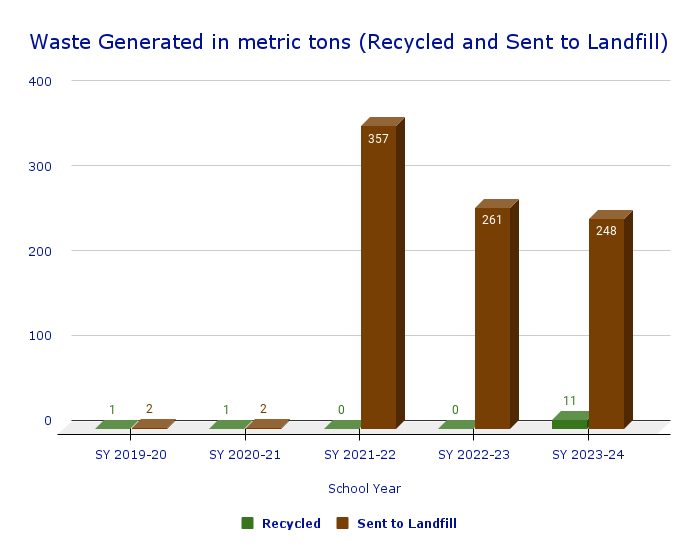
Ateneo de Manila University’s waste generation has exhibited a declining trend, from 261.12 metric tons (mt) in SY 2022-2023 to 259.12 mt in SY 2023-2024, with 28.98 mt recorded as of September 2024. Ateneo has also resumed its recycling efforts with 7.64 mt of wastes recycled so far in SY 2024-2025, following 11.01 mt recycled in SY 2023-2024 after a hiatus in SY 2022-2023. As of September 2024, Ateneo sent 21.34 mt to the landfill, down from 248.11 mt in SY 2023-2024 and 261.12 mt in SY 2022-2023.

Waste Generated (metric tons)
As of September 2024 of this School Year (2024-25), the total amount of waste generated by the University is 29.98 mt.
Return to Waste | Return to Top
Waste Recycled (metric tons)
As of September 2024 of this School Year (2024-25), the total amount of waste recycled is 7.64 mt.
Return to Waste | Return to Top
Waste Sent to Landfill (metric tons)
As of September 2024 of this School Year (2024-25), the total amount of waste sent to landfill is 21.34 mt.
Return to Waste | Return to Top
Scope 1 Emissions
- SY 2022-23: Scope 1 emissions were recorded at 63.41* tCO2e (tons of CO2 equivalent), indicating a relatively low level of direct emissions, likely from fuel use in campus vehicles or on-site energy production.
- SY 2023-24: Scope 1 missions increased, doubling to 138.21 tCO2e. This suggests increased direct energy usage, from a return to the post pandemic full campus operations.
Note: SY 2022-23 data adjusted due to additional data from University-issued vehicles (updated on 20250314)
Return to Waste | Return to Top
Scope 2 Emissions
- SY 2022-23: Scope 2 emissions were monitored at 6,420.79* tCO2e, evidencing a significant carbon footprint from electricity consumption.
- SY 2023-24: Scope 2 data shows an increase to 10,221.22 tCO2e indicating higher electricity use, resulting from upgraded physical facilities and campus activity.
Note: SY 2022-23 data adjusted due to new emission factor provided by the Department of Energy (DOE 2019-21 NGEF). Updated on 20250314
Return to Waste | Return to Top
Total Scope 1 & 2 for the Baseline Year
10,359.43* tCO2e
SY 2024-25 Scope 1 data not yet available. Data updated on 20250314
Return to Waste | Return to Top
Baseline Year began recording emissions GHG standards
School Year 2022-2023
Return to Waste | Return to Top
Other Metrics
Campus Building Footprint | University Floor Space | Sustainable Practices
Campus Building Footprint (m²)
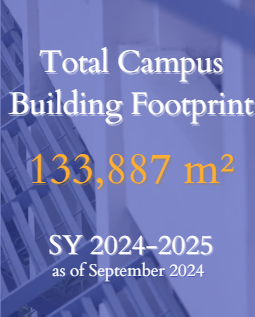
A campus building footprint refers to the area of land that a building occupies on a campus. It is typically measured in square feet or square meters and outlines the perimeter of the building at ground level.
For SY 2024-25 the University’s building footprint is 133,887 m².
Return to Other Metrics | Return to Top
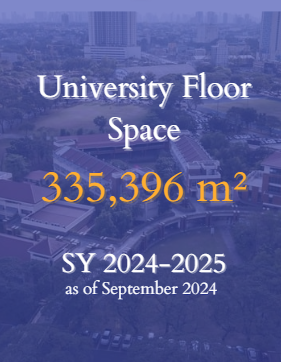
University Floor Space (m²)
Floor space refers to the total area of a building's floor, measured in square units (like square feet or square meters). It includes all usable areas within the walls of the structure, typically excluding vertical space, like ceilings or walls.
As of August 2024 of this School Year (2024-25), the total University floor space is measured as 335,396 m².
Return to Other Metrics | Return to Top
Sustainable Practices
Bicycles on Campus | EJeep: Passenger Volume | Pedestrians | Vehicles | School Buses | Electric Vehicles
Ateneo de Manila University promotes sustainable and environmentally friendly commuting to address campus vehicular transportation hazards. These practices include constructing seamless paved roads for walking, cycling routes, and carpooling through the electric jeepney. Additionally, the University provides a tricycle station for commuters in an effort to reduce carbon emissions and manage on-campus traffic. It is also a way for the University to socialize a campus-wide sustainability culture.
For more information on sustainable initiatives, please see this article.
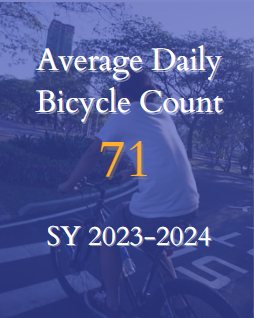
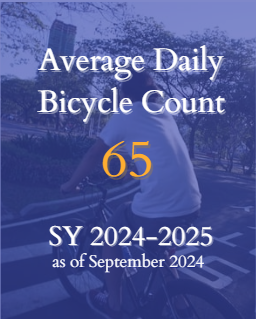
Bicycles on Campus
Daily average number of bicycles entering the University.
Return to Sustainable Practices | Return to Top
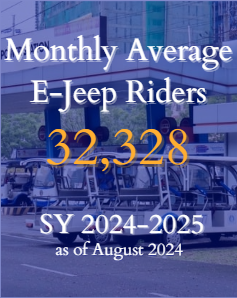
E-Jeep Shuttle Service: Passenger Volume
Monthly average number of E-Jeep Shuttle riders.
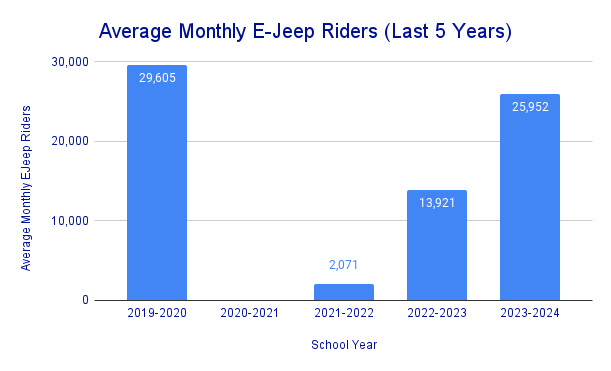
Return to Sustainable Practices | Return to Top
Pedestrians
Daily average number of pedestrians entering the University.
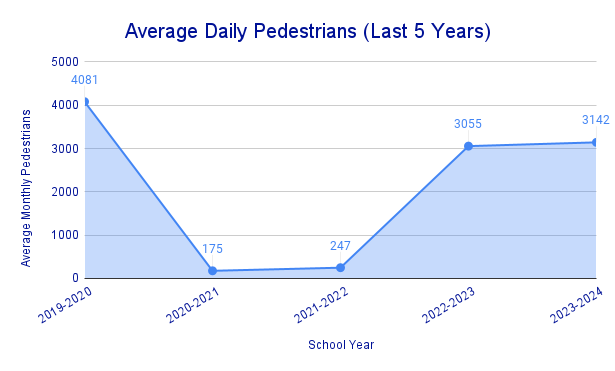
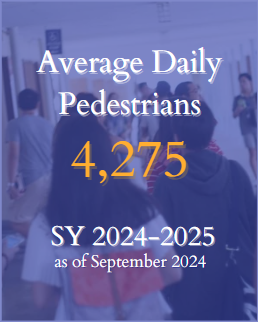
Return to Sustainable Practices | Return to Top
Vehicles
Daily average number of vehicles entering the University.
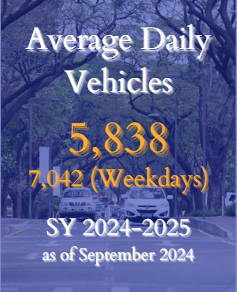
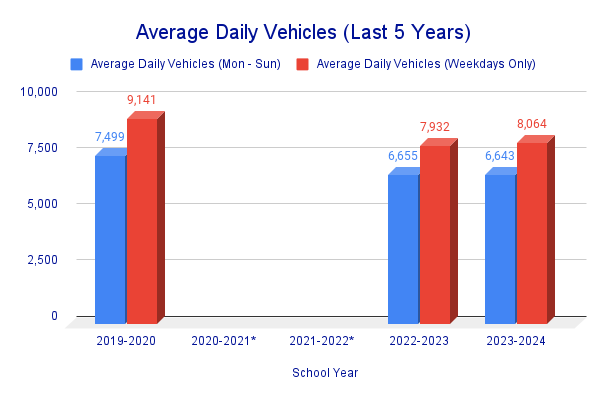
Return to Sustainable Practices | Return to Top
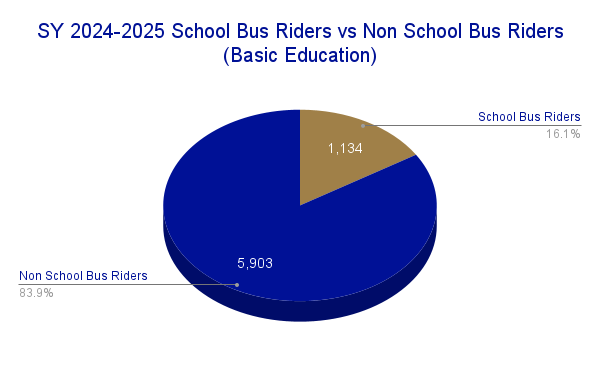
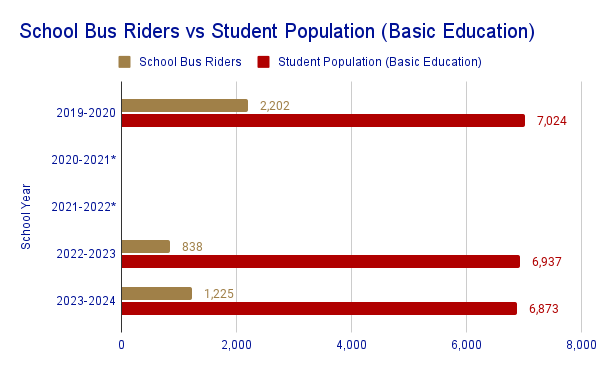
School Bus Service
Basic Education data of the number of school bus riders.
Return to Sustainable Practices | Return to Top
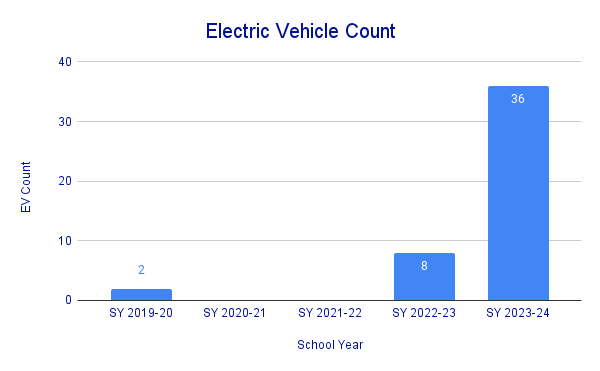
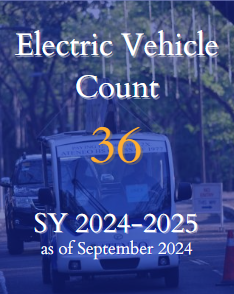
Electric Vehicles
Number of electric vehicles registered with the University.
Return to Sustainable Practices | Return to Other Metrics | Return to Top
Sources:
Ateneo Institute of Sustainability
Office of the Vice President for Administration
Central Facilities Management Office
Campus Safety and Mobility Office
Office of Food Safety and Quality Assurance
Strategy and Quality Management Office